
Videos and tutorials / nCloud Connect
Call queueing: supervisor guide
Monitoring queues and agents, listening in on calls, and running, exporting and scheduling queue reports.
About queueing
Call Queues are a powerful tool for automatically answering and distributing inbound calls to a business or organization, providing a better experience for both callers and the agents answering calls in the queue. Instead of offering each new call to a group of phones as it comes in, regardless of the users’ disposition or activity, a call queue automatically greets each caller with a welcome message and places them in queue. Callers hear hold music or other custom messaging while they wait for an available agent. Meanwhile, the queue will offer these calls on a first-in-first-out basis to agents considered available to take a call, meaning logged in and not already on a queue call. Call offers that go unanswered simply return to the queue, to be offered to the next available agent.
What this means is that there are no ‘missed’ calls, no need to manually answer calls only to immediately place them on hold so the preceding call can be wrapped up. Agents can process one call at a time in an efficient manner while callers are able to wait with confidence that their call will be answered by the first available agent.
NetCarrier call queueing also offers enhanced metrics and reporting capability, outbound calling, recording functions, and several other features all geared towards creating an optimal phone environment for high-volume scenarios.
Supervisor overview
Users assigned to a queue as a supervisor gain access to the queue monitoring and reporting tools in their nCloud user portal. They are found at the bottom of the left side menu under the ‘Reports’ section:
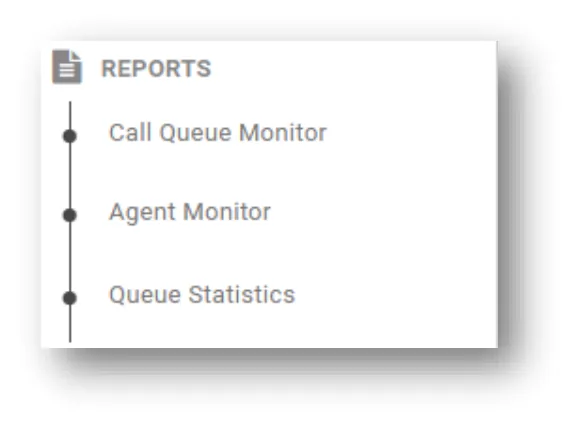
- Call Queue Monitor Allows supervisors to see current details of assigned queues including active calls in queue, staffing levels, and call recordings
- Agent Monitor Provides visibility and controls over the current status of assigned agents
- Queue Statistics Provides access to historic queue reporting tools
Supervisors also gain access to the live monitoring feature, which allows them to silently join an active queue call. This feature also includes controls to allow a supervisor to whisper to the agent unheard by the caller or to barge into the call, to be heard by both parties on the call.
Call Queue Monitor
The Call Queue Monitor offers quick access to information about current activity within queues assigned to the supervisor. The initial view displays a combination of statistics and links to expanded views for each queue.

Note: A supervisor will only see information on queues they are the supervisor of, and for agents assigned to those queues.
- Queue Name Displays the name and extension of the queue
- Recording If the queue has recording enabled, this link provides access to the queue recording page where recordings may be accessed and managed.
- Queue Status Displays the current status of the queue
- Agent Information Opens a pop-up window that displays agent counts in 4 categories:
- Idle Agents Number of agents not currently on a call
- Logged In Agents Current number of agents logged in
- Logged Out Agents Current number of agents logged out
- Agents in Queue Call Number of agents currently on an active queue call

Note: The following 5 columns display inbound call counts derived from the last 24 hours of activity.
- Answered Calls Number of inbound calls answered by an agent
- Max Wait Time Transferred Number of inbound calls that reached the max wait time in queue without being answered by an agent and where transferred to the queue fallback destination
- Breakaway Calls If the queue has a breakaway digit enabled, this displays the number of inbound calls that used the breakaway digit to transfer themselves to the breakaway transfer destination or callback IVR.
- Abandoned Calls Number of inbound calls that disconnected before being answered or reaching the max wait time
- Total Calls Number of inbound calls that entered the queue
Queue recording
If the queue has recording enabled, supervisors can access the queue recording interface by clicking on the link in the ‘Recording’ column of the Call Queue Monitor.

Supervisors can listen to recordings using the provided controls on the left side of each entry or download the audio file by clicking the blue icon on the far left. To search queue recordings, click on the grey ‘Search’ bar at the top of the page to display the search fields. Queue recordings can be searched by caller number or by answering agent.
Call Queue Monitor: expanded queue view

Supervisors are also able to view all active calls in a queue by clicking on the ‘expand’ button with the plus icon at the left of the queue listing in the Call Queue Monitor. This will open a new tab with a section for each type of call, inbound, outbound, and callbacks.
The inbound and outbound sections show data for active calls in queue while the callback section shows data for callbacks requested in the last 24 hours.
This page refreshes with updated information every 10 seconds. This feature can be disabled by unchecking the ‘Refresh every 10 seconds’ box in the top right corner.
Each section shows relevant information for each call type:
Inbound
- Caller Number Lists the number the caller is calling from
- Caller Name – If available, lists the name of the caller. May list the geographic area associated with the number if no name available.
- Queue Join Time Lists the time the call reached the queue
- Wait Time Tracks how long the call has waited in queue before being answered
- Call Duration Once answered, tracks the duration of the active call
- Agent Once answered, lists the name of the agent who has answered the call
- State Shows the current status of the call in queue:
- Trying Ringing available agents’ phones
- Waiting Waiting for available agents
- Answered Answered by an agent, ongoing conversation
- Abandoned Disconnected before call could be answered
Outbound
- Agent Lists the name and extension of the agent making the outbound call
- Called Number Lists the telephone number the agent is making a call out to
- Connected Lists the time the outbound call was made
- Duration Displays the duration of the outbound call
- State Shows the current status of the outbound call:
- Ringing Outbound call is ringing the destination
- Connected Agent is connected on the outbound call, ongoing conversation
Callbacks
Unlike the Inbound and Outbound sections which show information for active queue calls, the Callbacks section displays information for callbacks requested within the last 24 hours. Callbacks from further back can be searched using the interface on the Agent Dashboard.
- Callback Ticket Code A unique number which is assigned to each callback request
- Callback Number Number at which the caller would like to receive the callback
- Call Queue Extension Number Extension of the queue from which the caller requested the callback
- Caller Number Number the caller’s initial call into queue came from
- Callback Agent Name After a callback has been attempted, this field will display the name of the agent who made the callback attempt
- Callback Status Tracks whether an agent has attempted to fulfill the callback request
- Start Time Displays the date and time the callback was requested
- Callback Last Attempt Time Displays the date and time the callback was last attempted
Agent Monitor
The Agent Monitor displays realtime status information and statistics for all agents assigned to queues to which a supervisor is assigned. This page also contains controls for manipulating agent statuses as well.
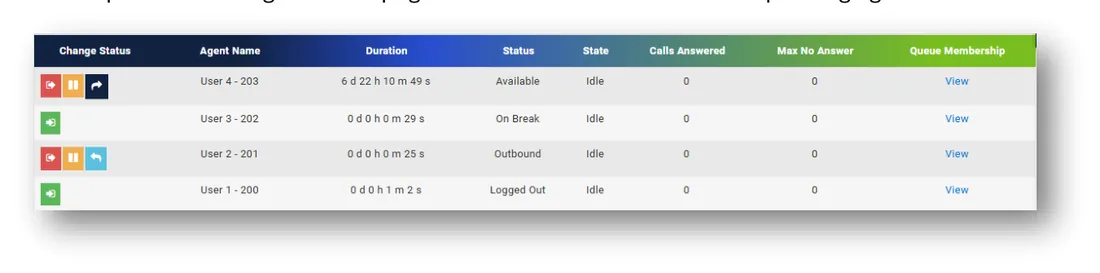
- Agent Name Displays the name and extensions of the agent
- Duration Displays the amount of time the agent has been in their current status
- Status Indicates the disposition of the agent:
- Available Logged in, not on a call, ready to accept inbound calls
- Logged out/On Break – Unable to make or accept queue calls
- Outbound Logged in, in outbound calling status, unable to accept inbound calls
- State Reflects the current activity of the agent:
- Idle No active call, ready to make or receive a queue call (depending on status)
- In a queue call Currently engaged on a call made or received through the queue
- Calls Answered Number of inbound calls answered in the last 24 hours
- Max No Answer Not a statistic but rather a setting, displays the maximum number of consecutive missed calls before agent is automatically logged out of queue. This setting can be changed in the nCloud admin portal.
- Queue Membership Click this link to display a pop-up window listing all queues to which this agent is assigned
Status controls
Controls for manipulating agent status are displayed on the left side of the Agent Monitor under the ‘Change Status’ column. What controls are displayed depend on the current status of the agent, i.e. an agent who is logged out or on break will only display the button for logging in whereas a logged in agent will have more options.

Live monitoring
Supervisors can monitor ongoing queue calls from their phone by dialing *56 followed by the agent’s extension (for example, *56111 to monitor agent x111’s active call). This will silently add them to the call while passing no audio to either party on the call. While monitoring, a supervisor can ‘whisper’ to the agent by pressing 2. This will allow their voice to be heard by the agent only. Supervisors may also ‘barge’ into the call allowing both parties to hear their voice by dialing 3. Dialing 0 will restore silent monitoring. A reference page listing these controls may be found in the supervisor’s nCloud user portal in the left side menu just above the reporting section under the heading Queue Monitoring DTMF Codes.
Queue Statistics
The Queue Statistics page contains 4 reports which provide historic data on queue and agent activity:
- Queue Traffic Overview Report Provides a detailed call log and data on overall queue performance
- Agent Statistics Report Contains metrics on agent’s interactions in queue including call counts, talk time, and answer rates
- Agent Activity Report Tracks agent status changes including log ins and log outs
- Peak Activity Report Graphs calls in queue and agents logged in over time
Supervisors are able to export these reports as well as automate them to run at a specific interval and be emailed out to designated recipients. To run a report, select the desired report type from the dropdown menu. A report displaying data for the last 24 hours will appear by default. To search a different date range or to edit any of the other available search parameters, click on the grey ‘Search’ bar at the top of the page to display search fields, which will differ depending on which type of report is selected. The blue ‘Search’ button can be used to run the report after editing the search parameters. The red ‘Reset’ button will clear all search parameters and reset the date range to the default.
Note: When selecting a date range, clicking on the ‘Date Time’ field will display a popup calendar. The first click on the calendar will select the start date for the range. The second click will select the end date.
Queue traffic overview report
The Queue Traffic Overview Report contains a call log which provides a detailed view of each caller’s experience in queue. It includes outbound calls and callbacks in this log as well to furnish a complete picture of queue activity at any given time. The report also provides several derived metrics to allow a supervisor to gain insight into how effectively a queue is addressing the volume of calls directed to it. Metrics on overall queue performance can be found in the top section of the report. If there are multiple queues included in the search, this data is aggregated across all queues.
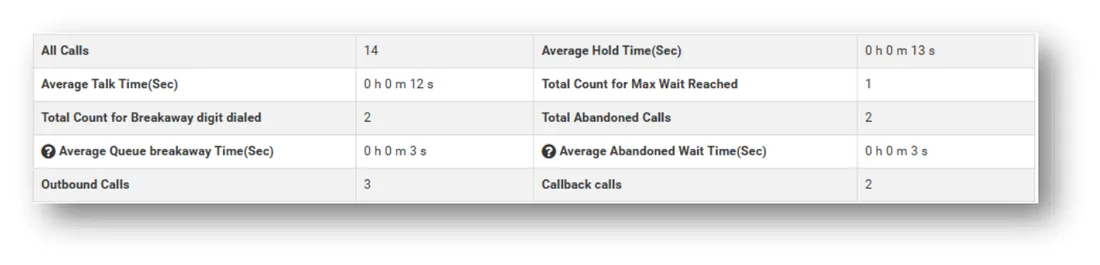
- All Calls Total number of calls in queue, including outbound calls and callbacks
- Average Talk Time Average duration of queue calls
- Average Hold Time Average duration of wait time in queue before calls are answered
- Total Count for Max Wait Reached Number of calls that waited the maximum amount of time allowed
- Total Count for Breakaway digit dialed Number of calls that utilized the breakaway digit to transfer out of queue
- Average Queue breakaway Time Average duration of wait time on calls which dialed the breakaway digit
- Total Abandoned Calls Number of calls that disconnected before an agent could answer or maximum wait time was reached
- Average Abandoned Wait Time Average duration of wait time on calls that were abandoned
- Outbound Calls Number of outbound calls made from queue
- Callbacks Number of callback attempts made from queue
The bottom section of the report contains the call log which will contain all calls from which the data in the top section is derived.
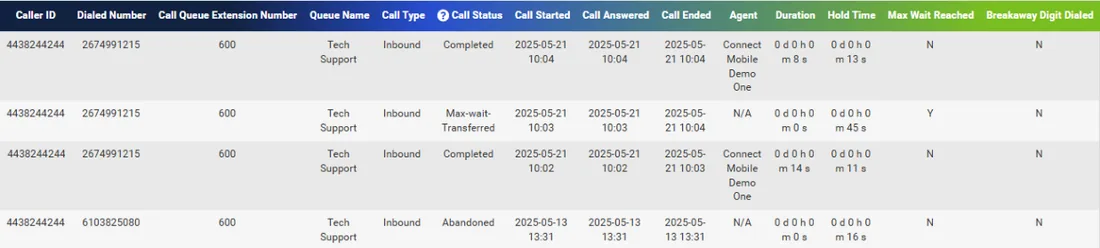
- Caller ID Number from which the call originated
- If it is an outbound call, this will be the extension of the agent who made the call
- If it is a callback, this is the number the callback request originated from
- Dialed Number Number which was dialed to reach the queue.
- If it is an outbound call, this is the external number the agent dialed
- If it is a callback, this is the number left in the callback request
- Call Queue Extension Number Extension of the queue associated with the call
- Queue Name Name of the queue associated with the call
- Call Type Reflects how the call originated (inbound, outbound, or callback)
- Call Status Reflects how the call ended (completed, abandoned, max-wait transferred, breakaway digit dialed)
- Call Started Timestamp showing when the call entered the queue
- Call Answered Timestamp showing when the call was answered by an agent
- Call Ended Timestamp showing when the call was ended
- Agent Displays the name of the agent who answered or made the call
- Duration Tracks duration of the call once answered
- Hold Time Tracks duration of wait time in queue
- Max Wait Reached Y/N did the call reach the maximum wait time allowed in queue
- Breakaway Digit Dialed Y/N was the breakaway digit dialed while waiting in queue
Search parameters include date/time, dialed number, caller ID, queue, call status, agent, and call type. Multiple queues and agents can be selected at once.
Agent statistics report
The Agent Statistics Report provides agent metrics on data points such as talk time and call counts in order to illustrate how effectively agents are interacting with the queue.
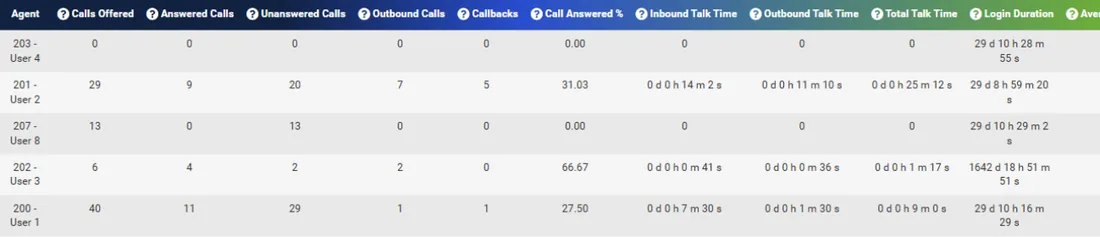
The following statistics are provided for each agent assigned to a queue for which the supervisor is assigned:
- Agent Name and extension of the agent
- Calls Offered Number of inbound call offers the agent received
- Answered Calls Number of inbound call offers answered by the agent
- Unanswered Calls Number of inbound call offers missed or declined by the agent
Note: The Calls Offered, Answered Calls, and Unanswered Call columns are inbound-only statistics that track the number of times a call was offered to an agent rather than individual calls into queue. Since it is possible for calls to be offered to multiple agents at once, or offered multiple times, the total number of calls offered will be different from the number of total calls noted in the Queue Traffic Overview Report. Both reports will always show the same number of answered calls.
- Outbound Calls Number of outbound calls made by the agent
- Callbacks Number of callback attempts made by the agent
- Call Answered % Percentage of inbound call offers answered by the agent
- Inbound Talk Time Total duration of inbound calls answered by the agent, including callbacks
- Outbound Talk Time Total duration of outbound calls made by the agent
- Total Talk Time Total duration of calls of any type
- Login Duration Total time spent logged in
- Average Call Processing Time Average duration of a call made or answered by the agent
- Occupancy Rate Percentage of logged in time spent on a phone call
Search parameters include date/time and agent.
Peak activity report
The Peak Activity Report displays the number of active calls in queue alongside the number of agents logged into queue over time within an interactive line graph. The report is meant to provide supervisors with a tool for showing the demand on their agents over time in a way that makes it easy to identify periods of inadequate or excess coverage.
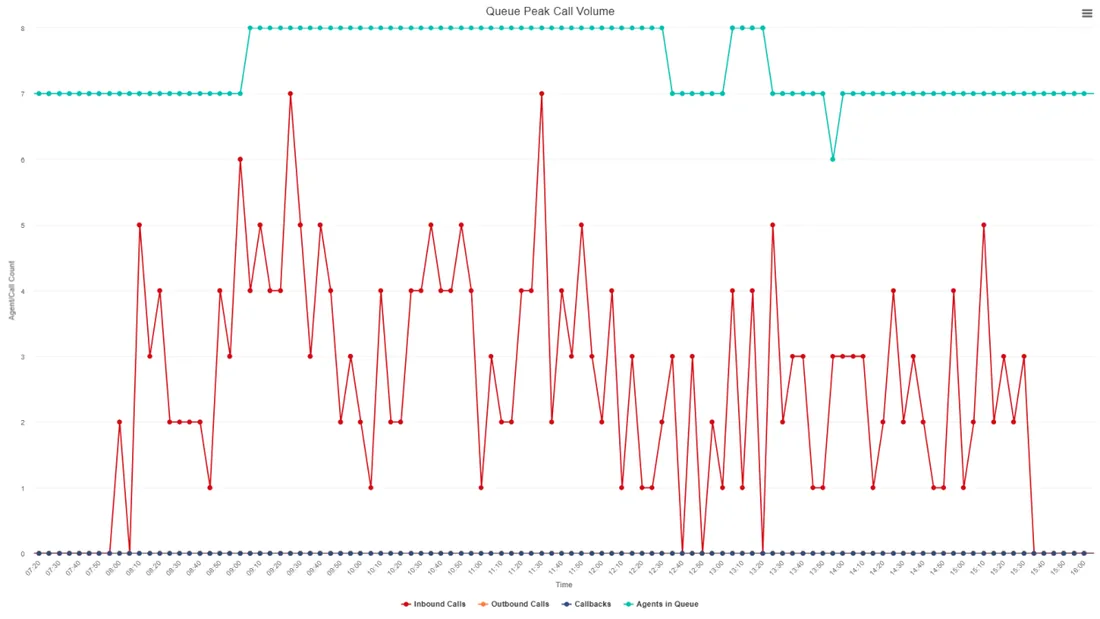
The graph shows four lines, one for each different call type and one tracking the number of agents logged into queue. When data for multiple queues is being displayed, the graph will show the aggregate counts from all queues together.
- Holding the mouse over any data point will display its details
- Any given line can be hidden from view by clicking on its label in the legend under the graph
- To zoom in to any part of the graph, click and drag the mouse to create a border around the area you wish to display. The view will adjust when the mouse button is released. To reset the zoom, click on the button that appears in the upper right corner.
Searchable parameters include date/time, and call queue.
Agent activity report
The Agent Activity Report provides a log of agent status changes for the purpose of tracking schedule compliance and agent availability.
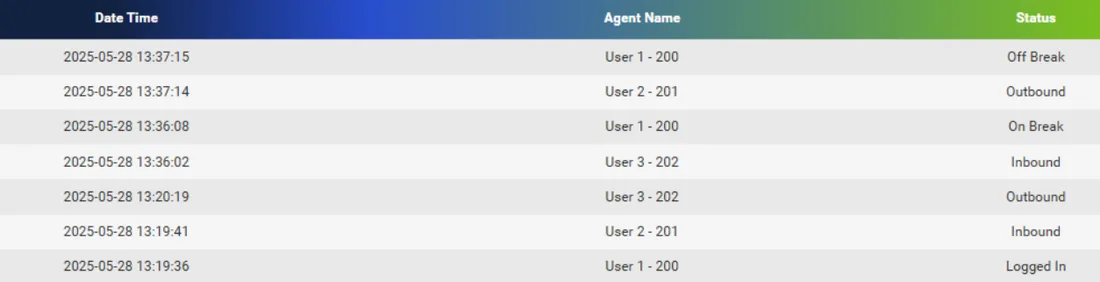
- Date Time Gives a timestamp for when the status change occurred
- Agent Name Name and extension of the agent
- Status Details the status change that occurred:
- Logged In / Logged Out Agent logged in or out of queue
- On Break / Off Break Agent went on or off break status
- Inbound / Outbound Agent switched between inbound and outbound status
Note: Agents are automatically set to Inbound status when logging in, the Inbound status change will only display when switching back to Inbound from the Outbound status.
Searchable parameters include date/time, agent, and status change type. Multiple statuses can be selected at once.
Exporting reports

Each Queue Statistics report can be easily exported to .csv format for long term data storage or further analysis in a spreadsheet program using the ‘Export Csv’ button that appears near the top right corner of the report.
Most exports are ready within a few minutes, this time may be longer if there is a large amount of data contained in the report. Multiple reports may be queued for export at once.
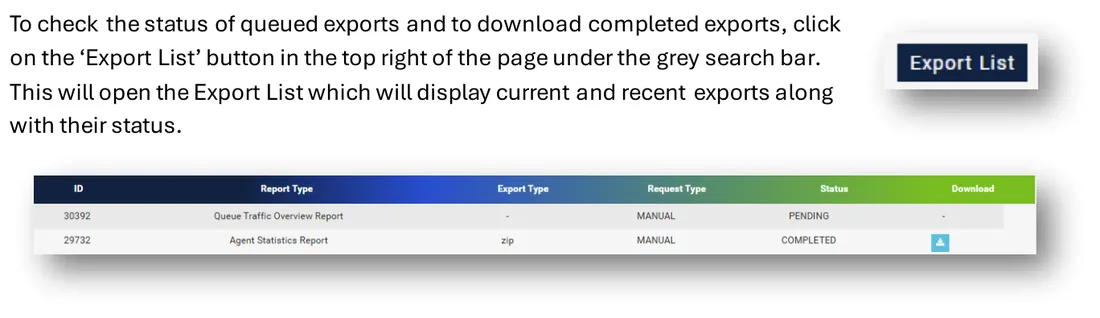
A blue ‘Download’ button will appear on the right side of the export list entry once the file is ready for download.
Scheduling automated reports
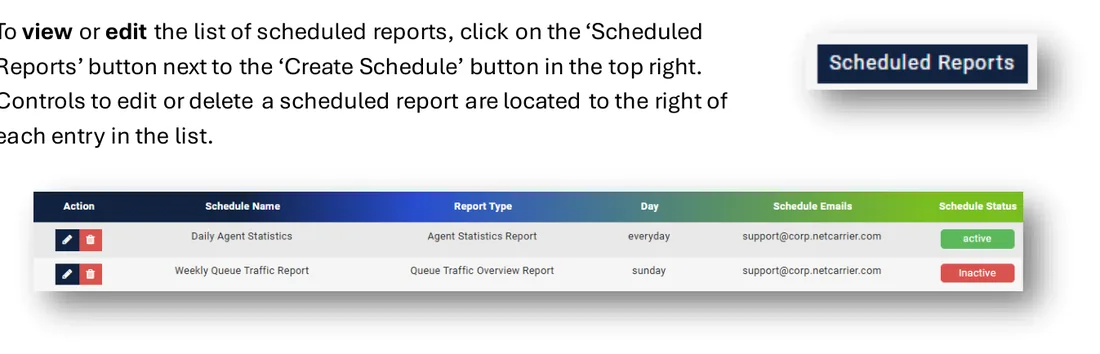
Supervisors can schedule any of the Queue Statistics reports to be run automatically on a daily, weekly, or monthly basis and have a download link for the export emailed to specified recipients.

To schedule a report, click on the ‘Create Schedule’ button in the top right of the queue statistics page under the grey search bar and begin filling out the provided fields as desired:
- Schedule Name Name of the scheduled report that will appear on the emailed notifications and the scheduled report list
- Status May be active or inactive, inactive reports do not run until switched to active from the scheduled report list
- Day Determines the interval at which the report will run:
- Monthly runs once every month pulling data from the previous month
- Everyday report runs daily, pulls data from the previous day
- Named weekday Report runs once a week on the day specified, pulls data from the preceding week
- Report Type Determines which type of queue statistics report will be run. Selecting a report will cause the searchable parameters for that report type to appear.
- Schedule Emails Field for entering the email addresses of recipients of the scheduled report. Multiple email addresses can be entered but must be separated by a comma.
Note: The email notifications that are sent out to recipients after a scheduled report is run contain a download link for the export which expires after 3 days.
Still stuck?
Our U.S.-based support team answers 24/7/365.